Article author(s):


The latest CMBS research work, led by Dr. Bin Wu, has made it to the cover of Insects journal!

This study established a novel real-time diagnostic tool for quick crapemyrtle bark scale (CMBS) host evaluation. Canonical host range confirmation of invasive hemipterans relies on the evaluation of plant susceptibility through greenhouse or field trials, which are inefficient and time-consuming. The researchers developed an alternative technology to complement conventional host confirmation methods. Using electrical penetration graph (EPG)-based technology, the research team monitored the CMBS invisible stylet-tip position when the insect was feeding on different plant tissues. The occurrences of stylet-tip in the phloem phase and xylem phase offered conclusive evidence for host plant evaluation. Moreover, CMBS typical feeding behaviors measured by EPG-based data analysis revealed how CMBS susceptible plants differed from non-susceptible plants.
Abstract: Host range confirmation of invasive hemipterans relies on the evaluation of plant susceptibility through greenhouse or field trials, which are inefficient and time-consuming. When the green industry faces the fast-spreading threat of invasive pests such as crapemyrtle bark scale (Acanthococcus lagerstroemiae), it is imperative to timely identify potential host plants and evaluate plant resistance/susceptibility to pest infestation. In this study, we developed an alternative technology to complement the conventional host confirmation methods. We used electrical penetration graph (EPG) based technology to monitor the A. lagerstroemiae stylet-tip position when it was probing in different plant tissues in real-time (Figure 1).
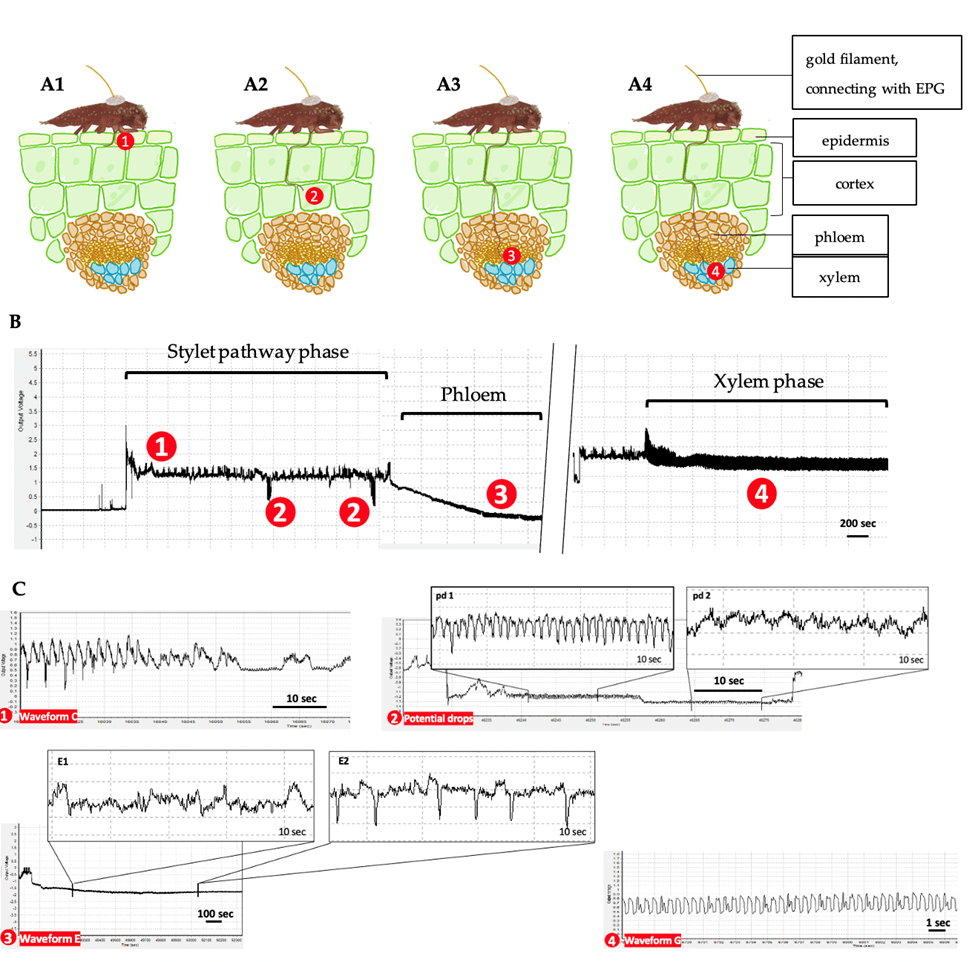
The frequency and relative amplitude of insect EPG waveforms were extracted by an R programming-based software written to generate eleven EPG parameters for comparative analysis between plant species (Figure 2).

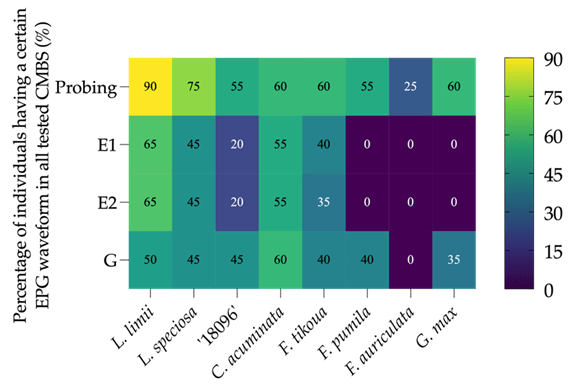
The results demonstrated that the occurrences of the phloem phase and xylem phase offered conclusive evidence for host plant evaluation (Figure 3). Furthermore, parameters including the percentage of insects capable of accessing phloem tissue, and time duration spent on initiating the phloem phase and ingesting phloem sap, provided insight into why host plant susceptibility differs among similar plant species. In summary, this study developed a novel real-time diagnostic tool for quick A. lagerstroemiae host confirmation, which laid the essential foundation for effective pest management.
To access the full article for details, please visit https://doi.org/10.3390/insects13060495


